Plot feature expression in dimensional reduction.
Usage
PlotExpression.SingleCellExperiment(
  object,
  color.by,
  dimred,
  scale.values,
  color.scale,
  plot.theme,
  legend.title,
  point.size,
  point.stroke
)

# S4 method for class 'SingleCellExperiment'
PlotExpression(
  object,
  color.by,
  dimred = tail(reducedDimNames(object), n = 1),
  scale.values = FALSE,
  color.scale = "inferno",
  plot.theme = theme_classic(),
  legend.title = color.by,
  point.size = 1,
  point.stroke = 1
)
Arguments
- object
An object of
SingleCellExperimentclass.- color.by
Categorical variable available in
colData(object)to plot.- dimred
Dimensional reduction available in
ReducedDimNames(object)to plot. By default the last dimensional reduction in the object is used.- scale.values
Logical specifying if values should be scaled. By default
FALSE, i.e., values are not scaled.- color.scale
Character of color scale palette to be passed to
ggplot2::scale_color_viridis_c. By defaultinferno. Other palettes are also available such asviridis.- plot.theme
Plot theme available in
ggplot2. By defaulttheme_classic().- legend.title
Legend title. By default the same as given at
color.by.- point.size
Size of points. By default
1.- point.stroke
Size of stroke. By default
1.
Examples
# Import package
suppressPackageStartupMessages(library("SingleCellExperiment"))
# Create toy SCE data
batches <- c("b1", "b2")
set.seed(239)
batch <- sample(x = batches, size = nrow(iris), replace = TRUE)
sce <- SingleCellExperiment(assays = list(logcounts = t(iris[,1:4])),
colData = DataFrame("Species" = iris$Species,
"Batch" = batch))
colnames(sce) <- paste0("samp", 1:ncol(sce))
# Compute dimensional reduction
sce <- RunPCA(object = sce, assay.name = "logcounts", p = 4,
pca.method = "stats")
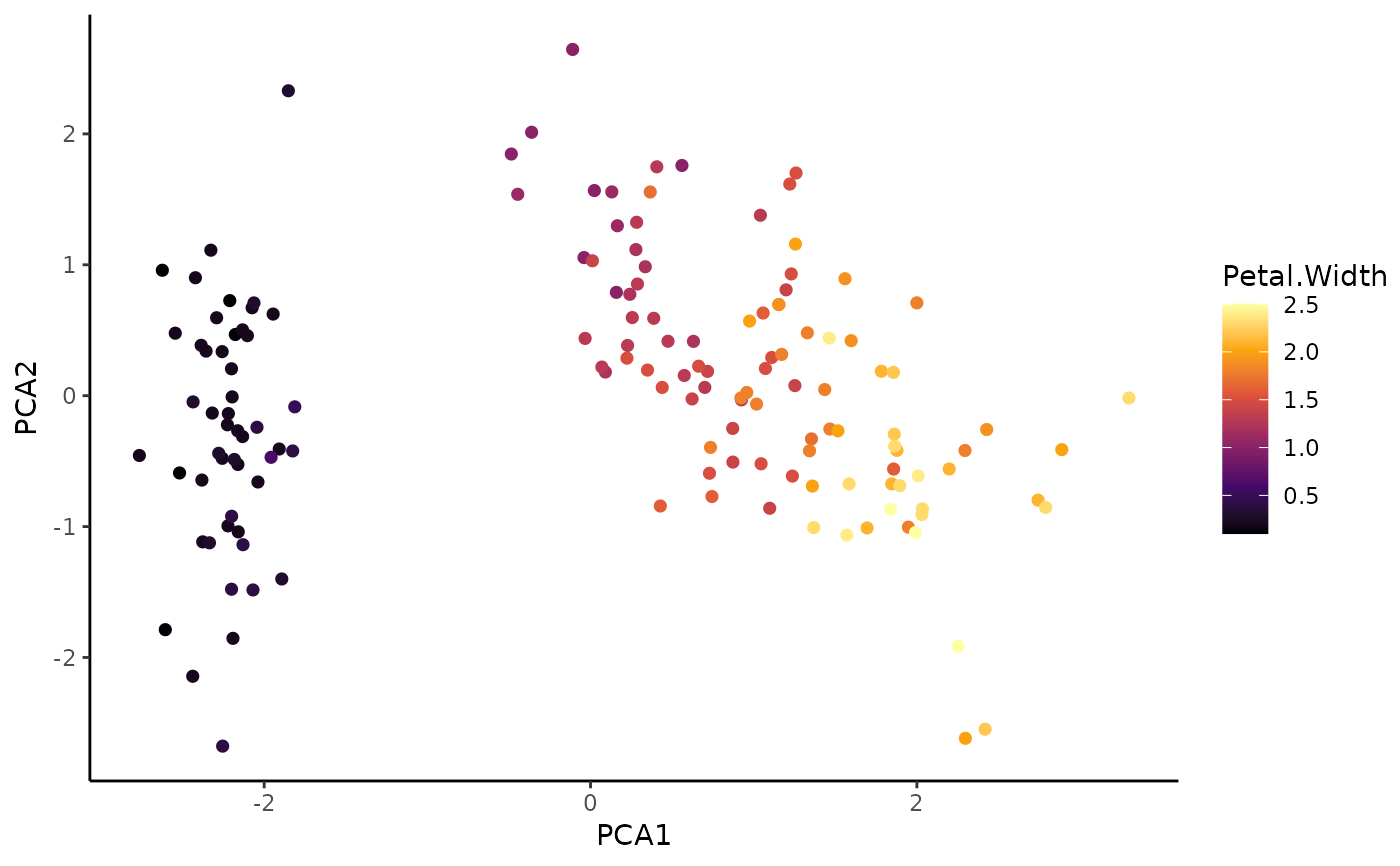
# Plot expression level of one or more features
## one
PlotExpression(object = sce, color.by = "Petal.Width")
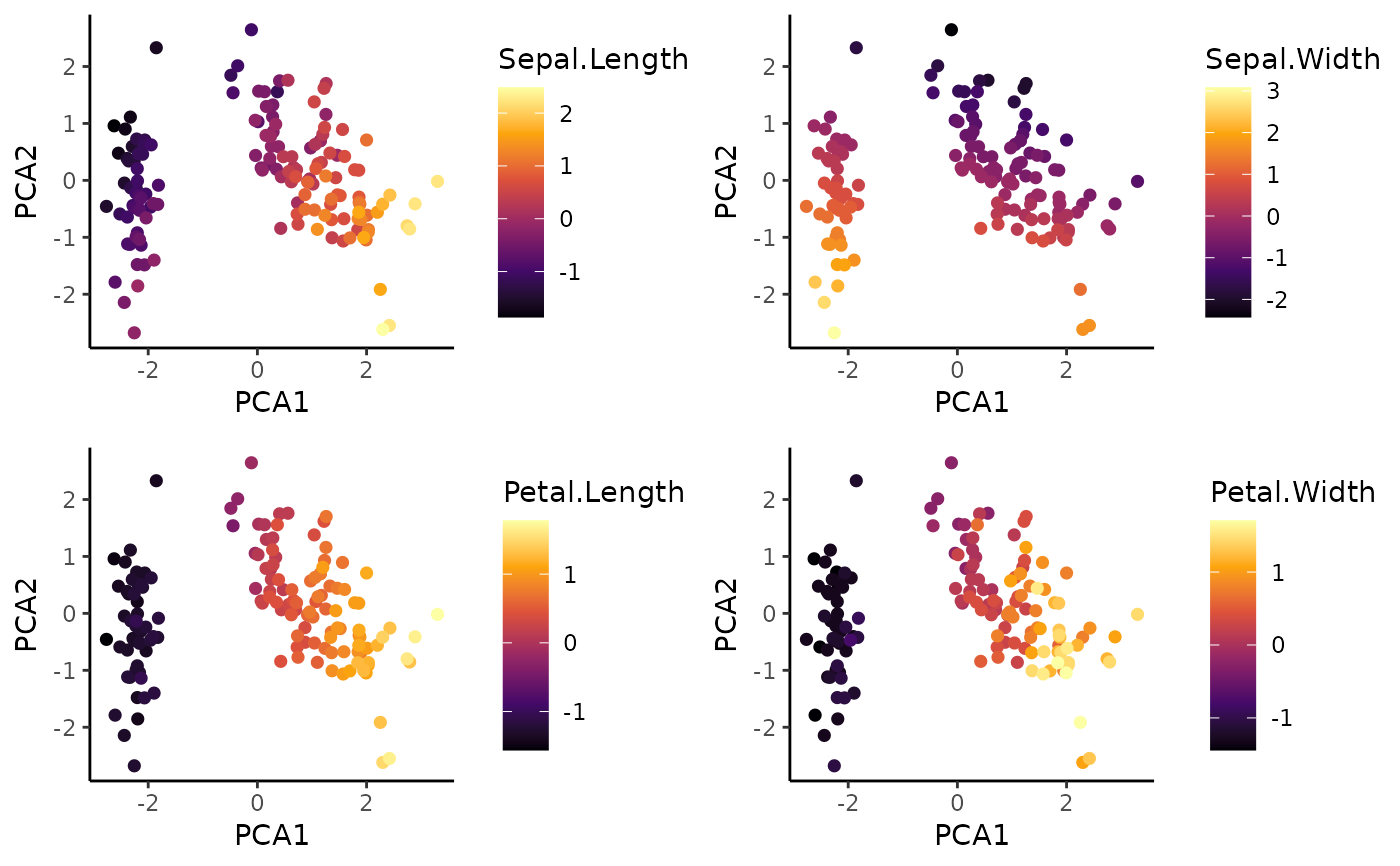
 ## more than one
features <- row.names(sce)[1:4]
exp.plots <- lapply(X = features, FUN = function(x) {
PlotExpression(object = sce, color.by = x, scale.values = TRUE)
})
cowplot::plot_grid(plotlist = exp.plots, ncol = 2, align = "vh")
## more than one
features <- row.names(sce)[1:4]
exp.plots <- lapply(X = features, FUN = function(x) {
PlotExpression(object = sce, color.by = x, scale.values = TRUE)
})
cowplot::plot_grid(plotlist = exp.plots, ncol = 2, align = "vh")